|
|
DNA Damage Atlas |
|
|
DNA Damage Atlas |

1. Browse module
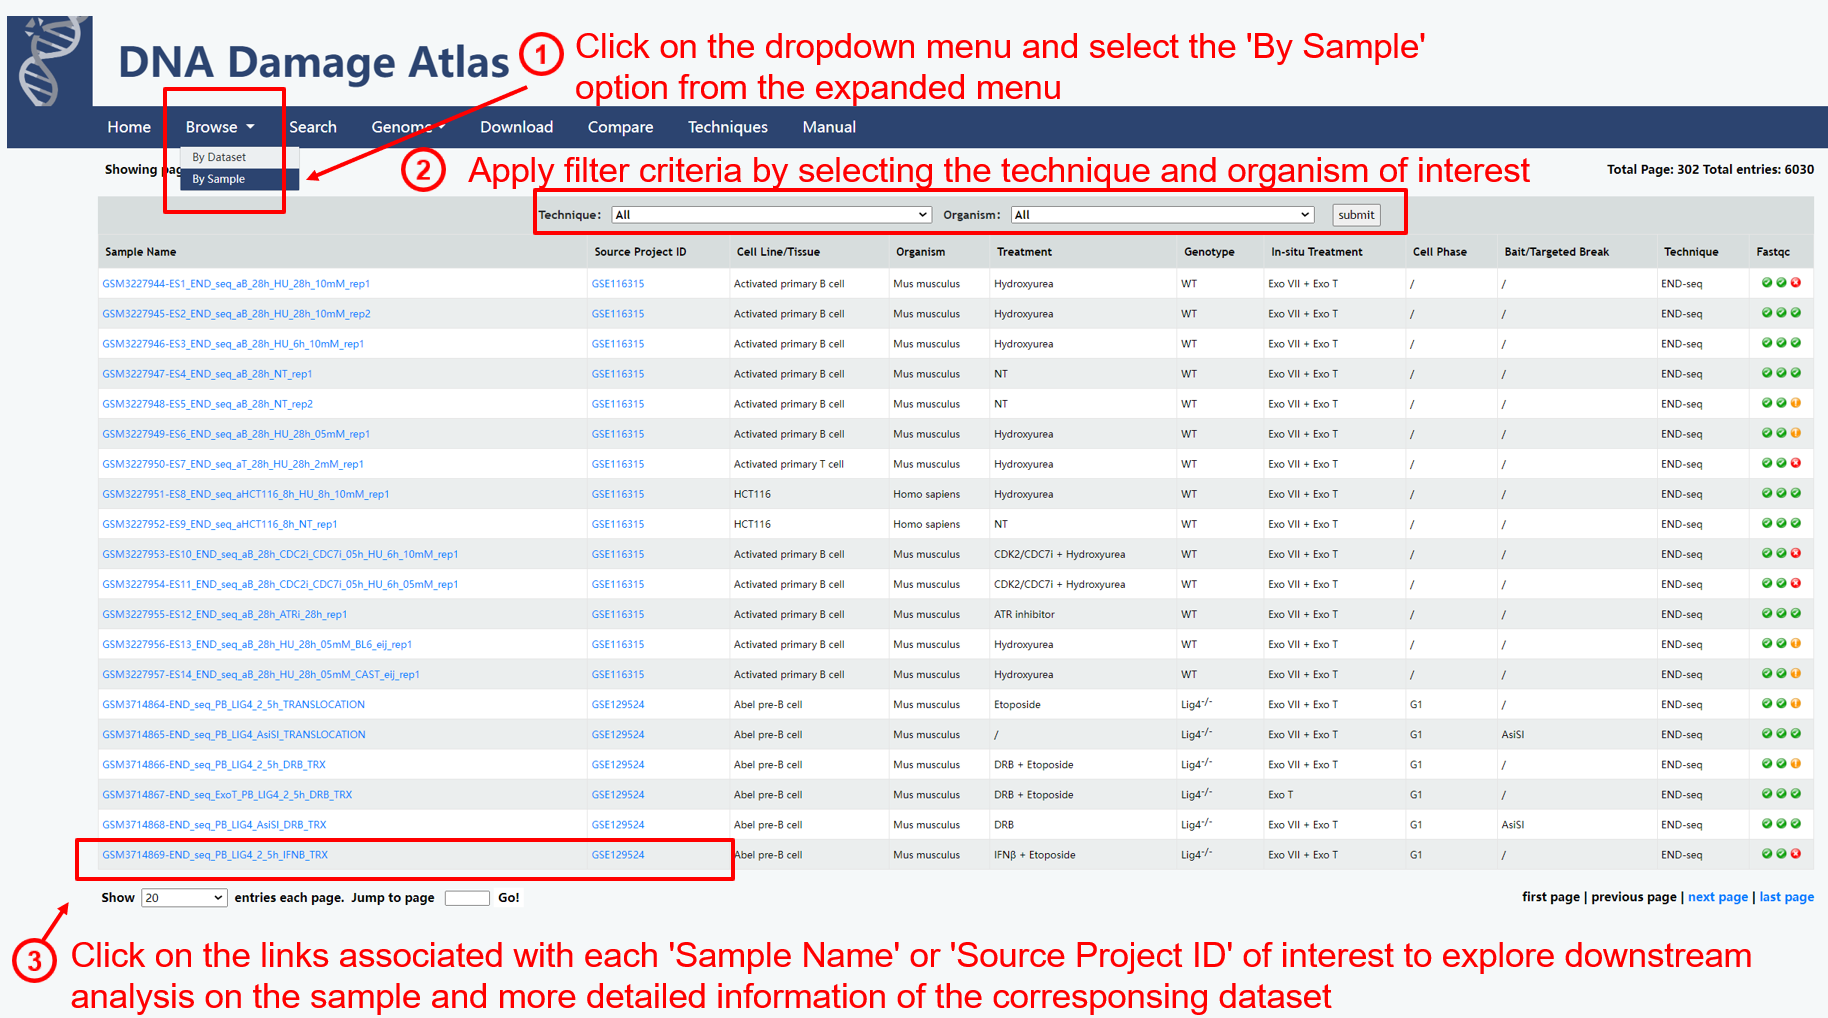
1.1. Browse by sample
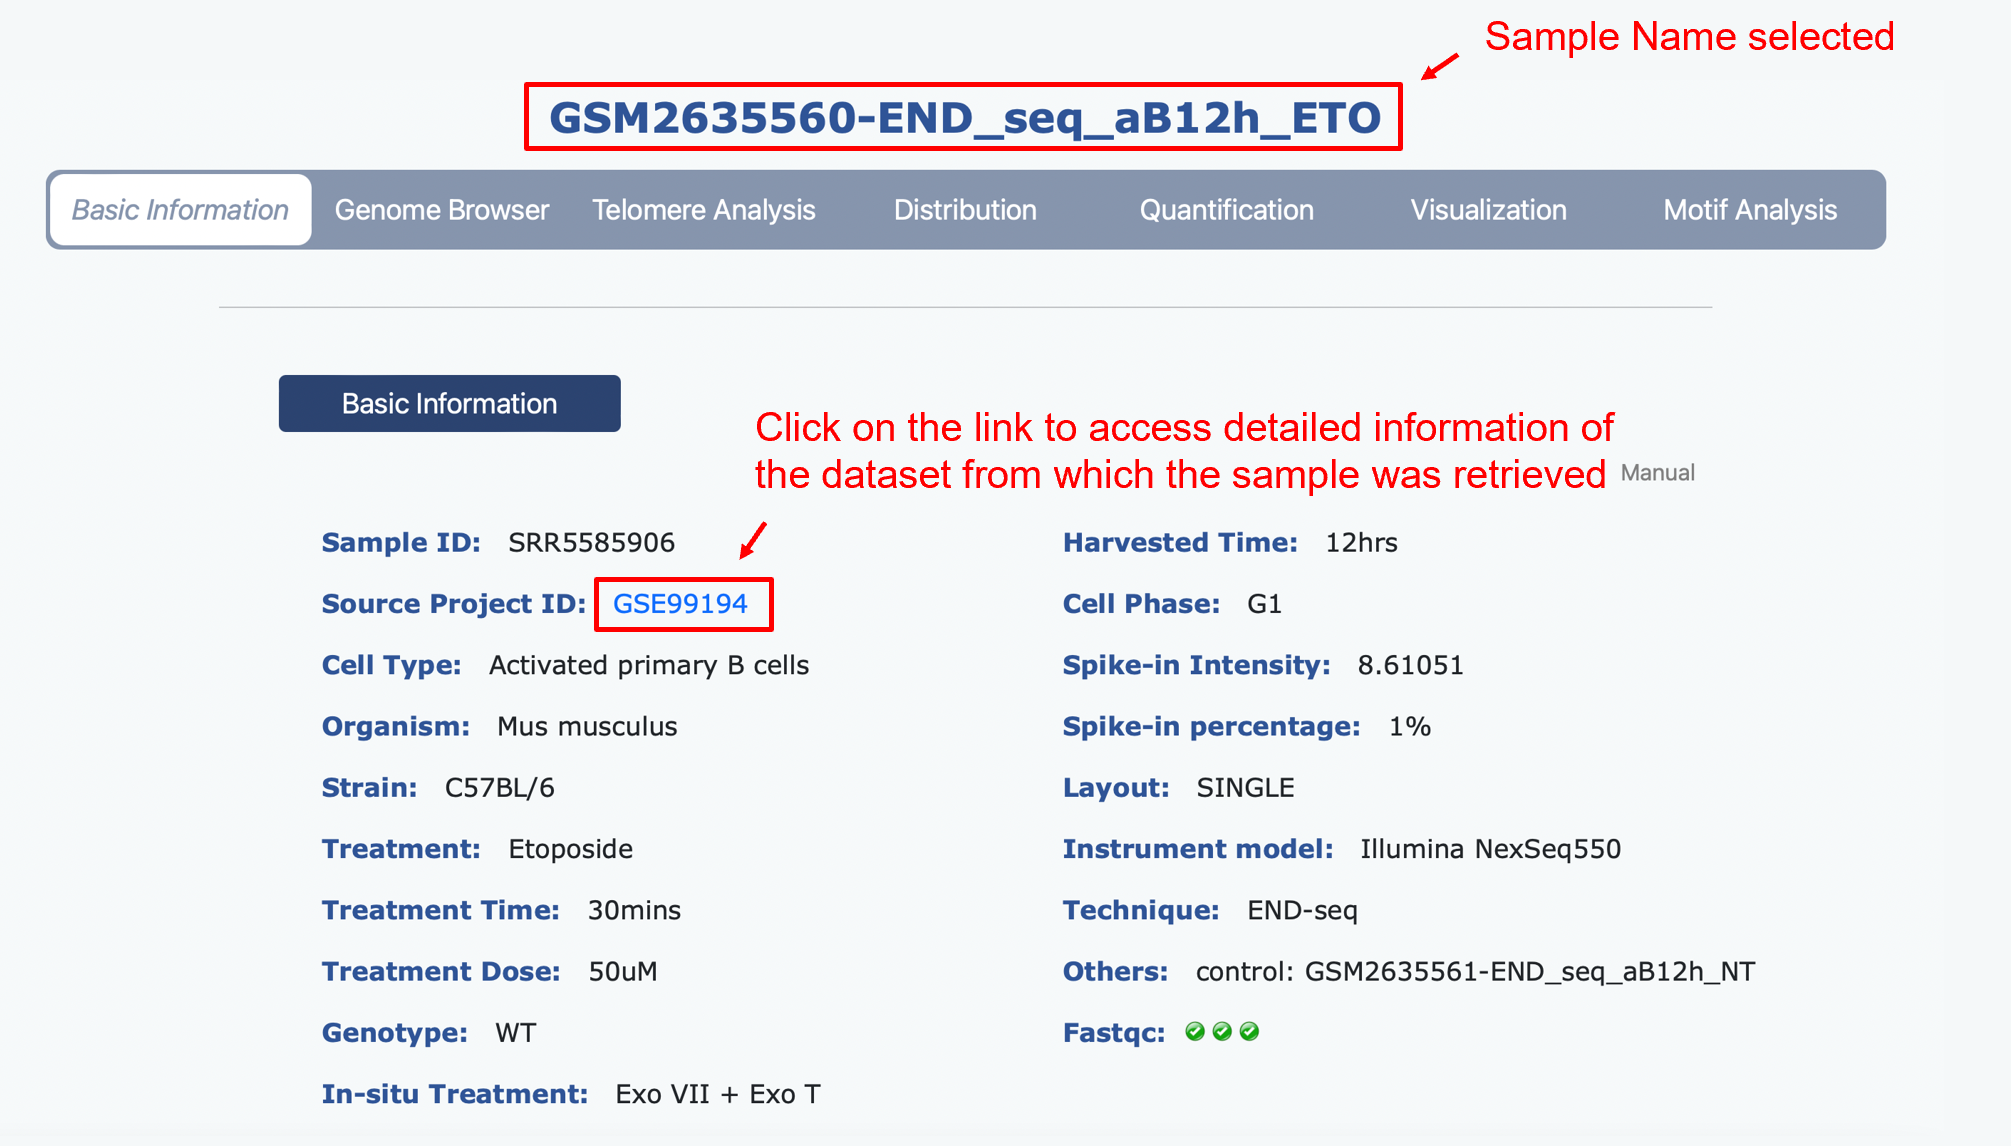
Basic Information
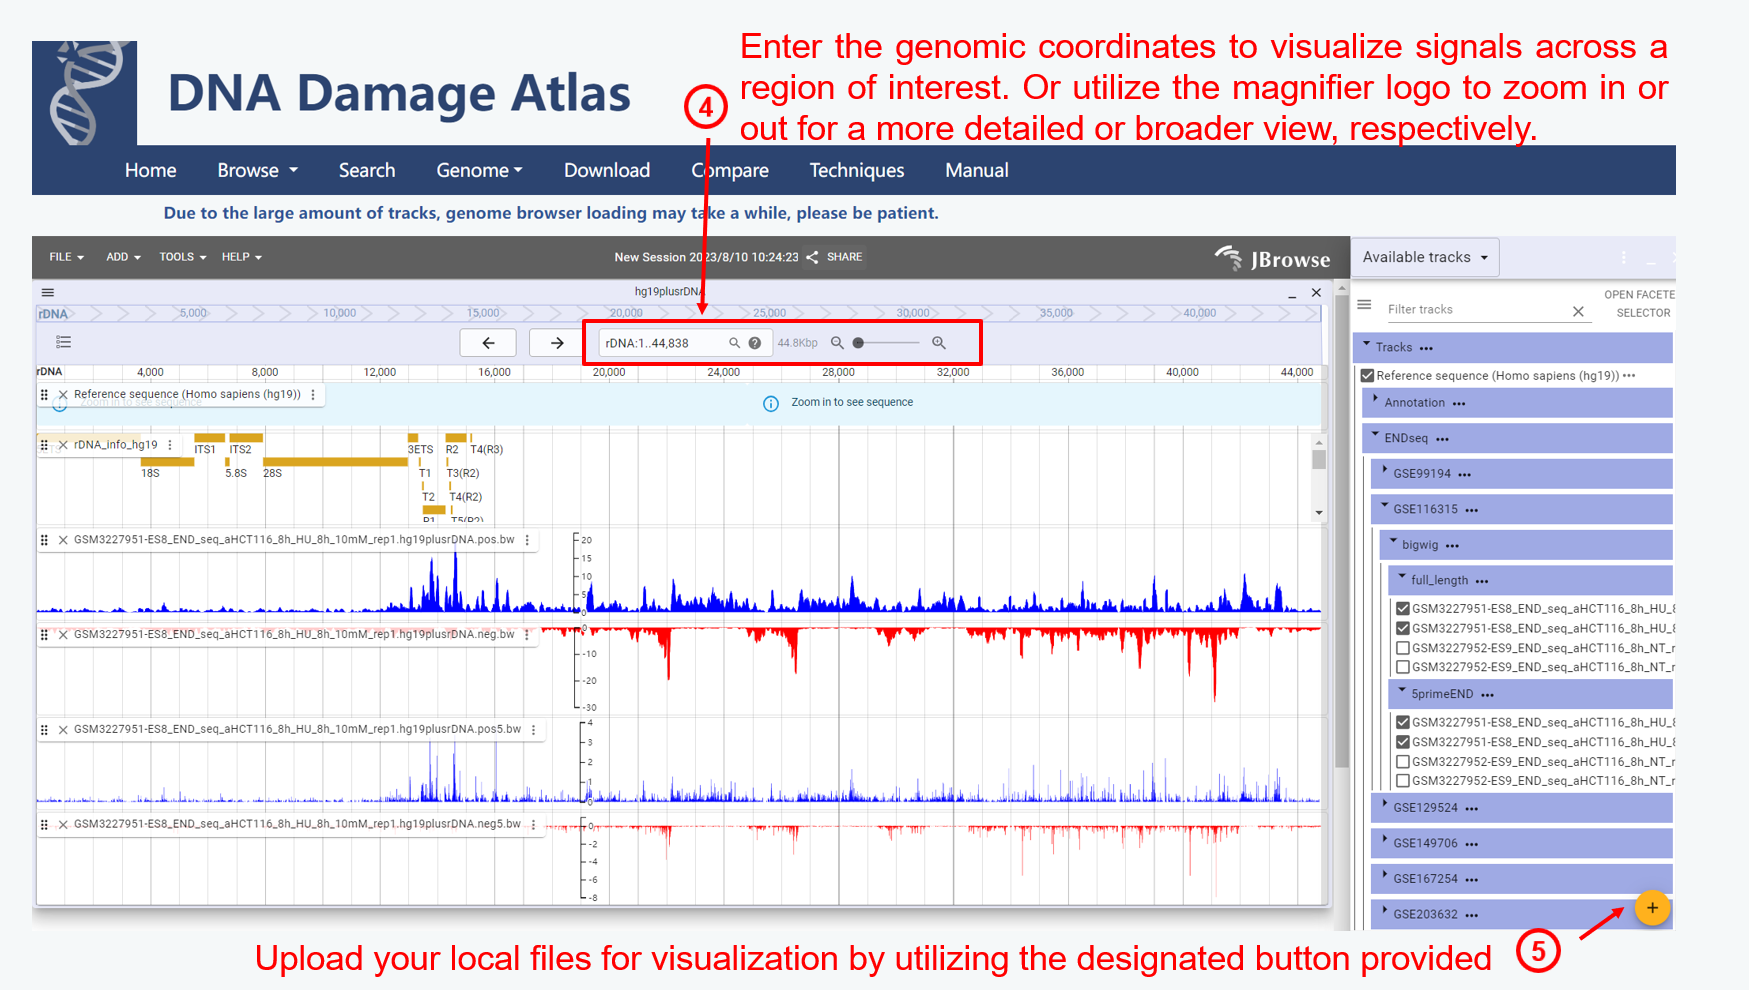
Genome Browser


Telomere Analysis
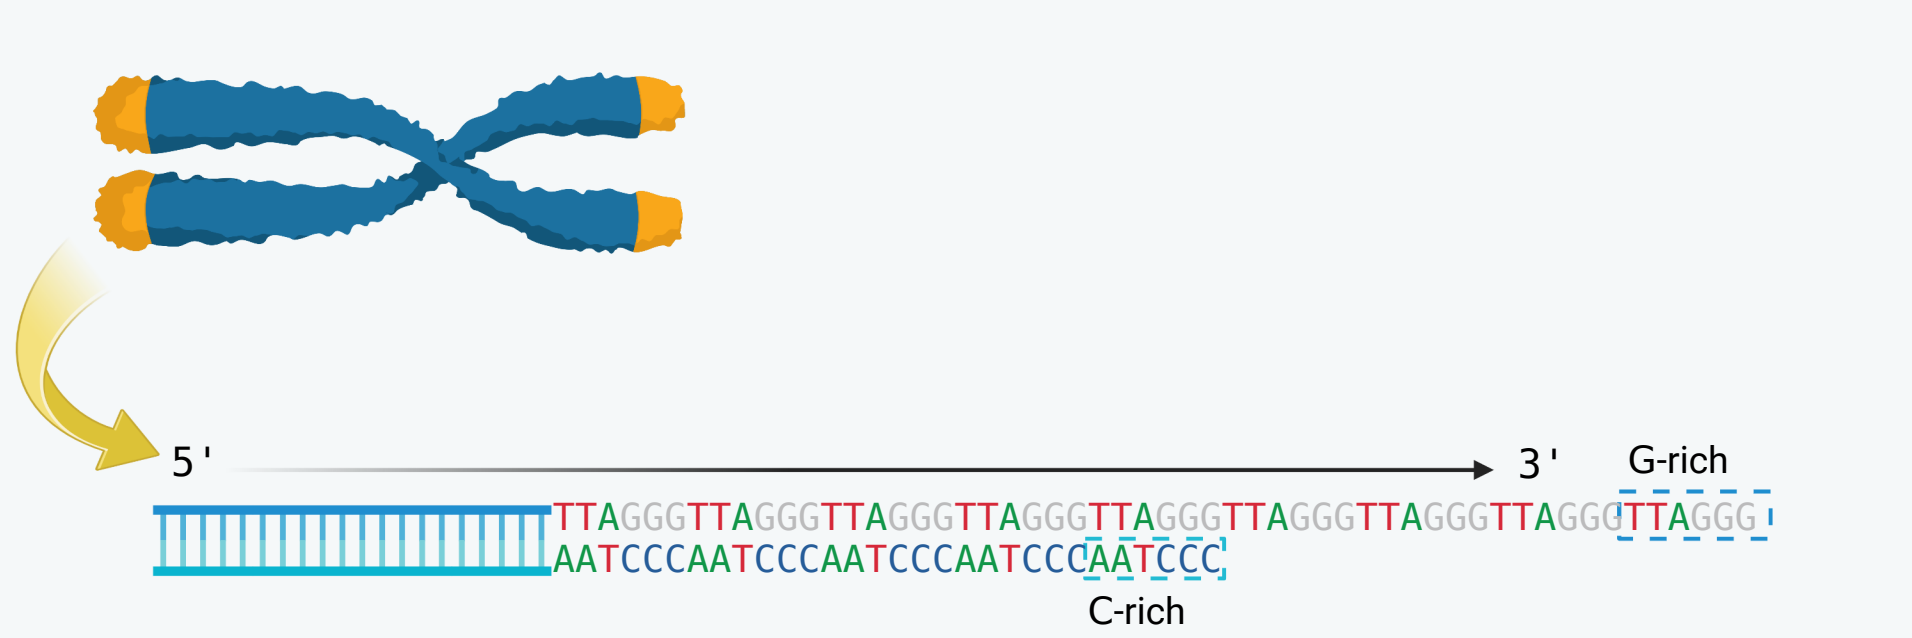
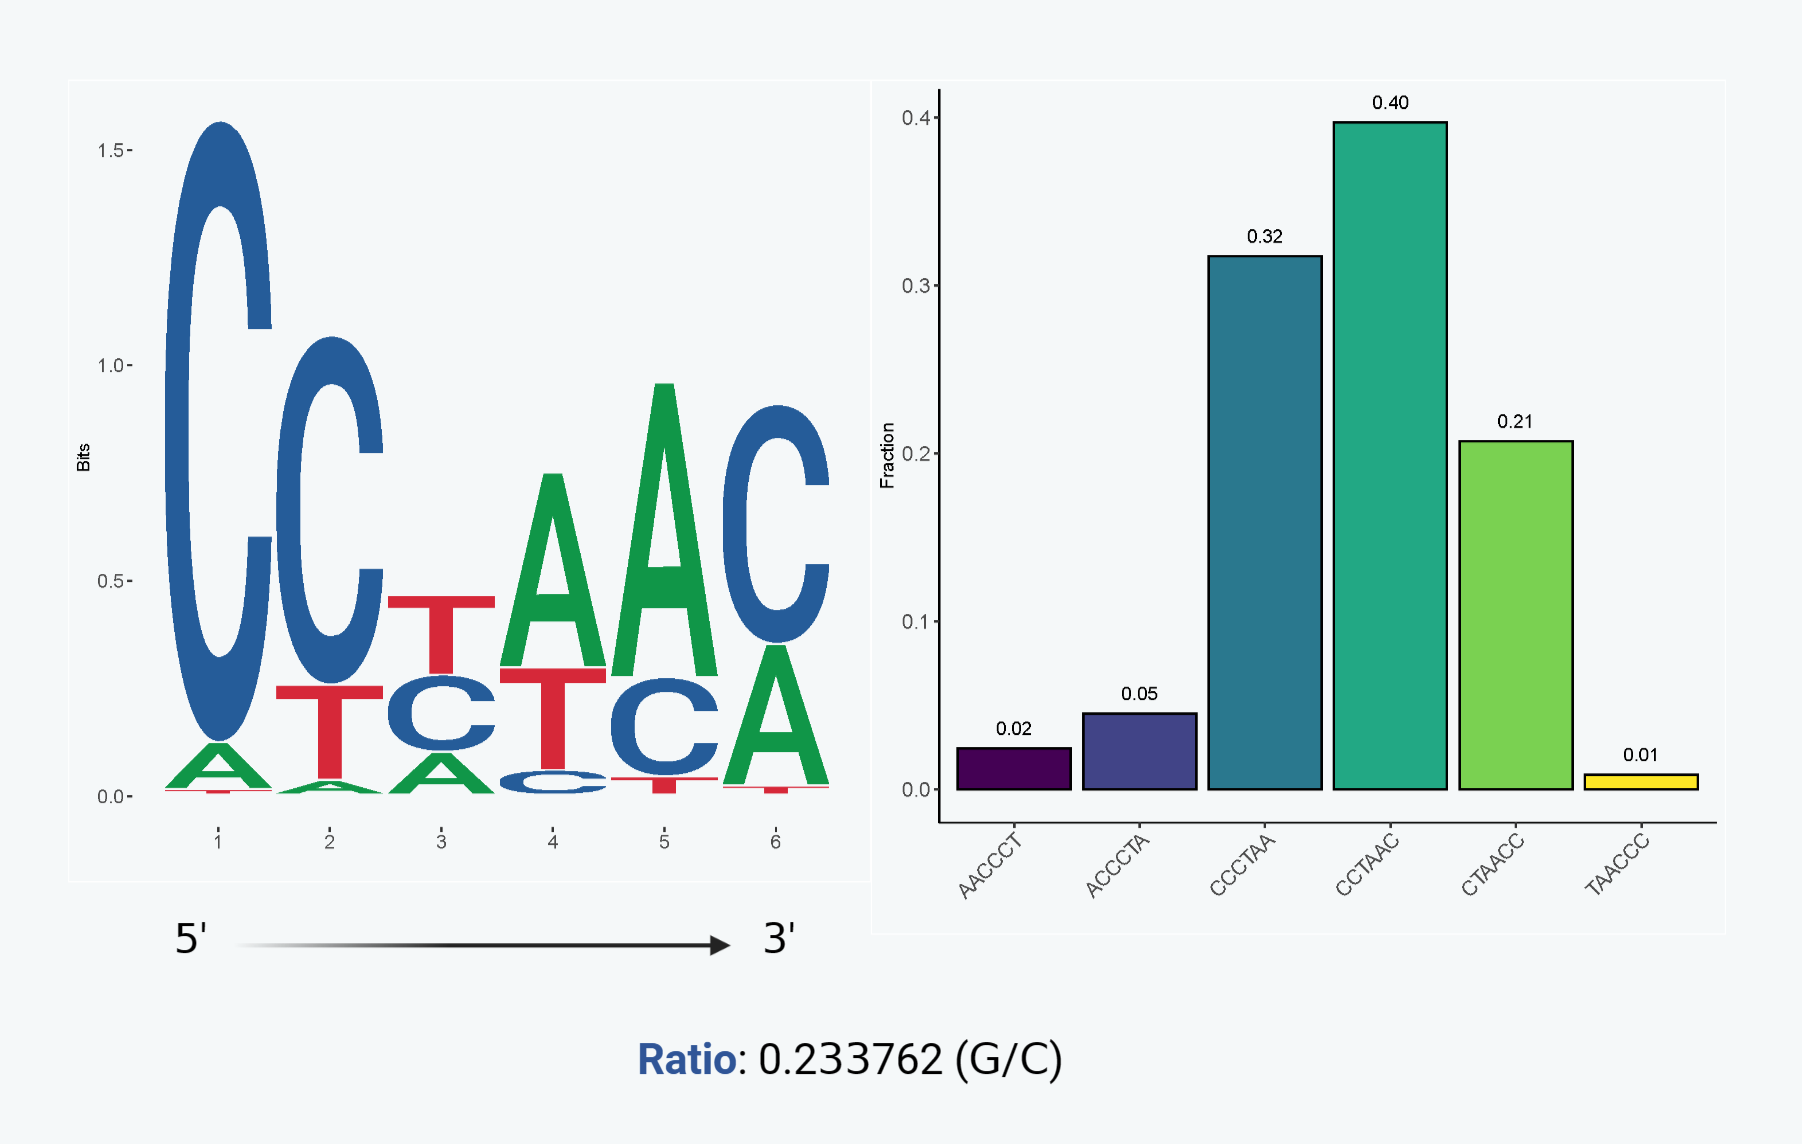
Telomeres, which are located at the ends of linear chromosomes, are composed of repeated sequences, specifically 5'-TTAGGG/3'-AATCCC, in mammalian organisms. Post-replication processing occurs at telomere ends to generate the G-rich 3' (repeated TTAGGG) overhang which plays a crucial role in telomere shortening. The overhang forms a protective structure known as the 'T-loop' which helps maintain genome integrity by preventing degradation and end-to-end fusion. Studies have demonstrated that a significant proportion, approximately 80%, of human C-rich (AATCCC) strands terminate in CCAATC-5’, strongly indicating the existence of a tightly regulatory mechanism.
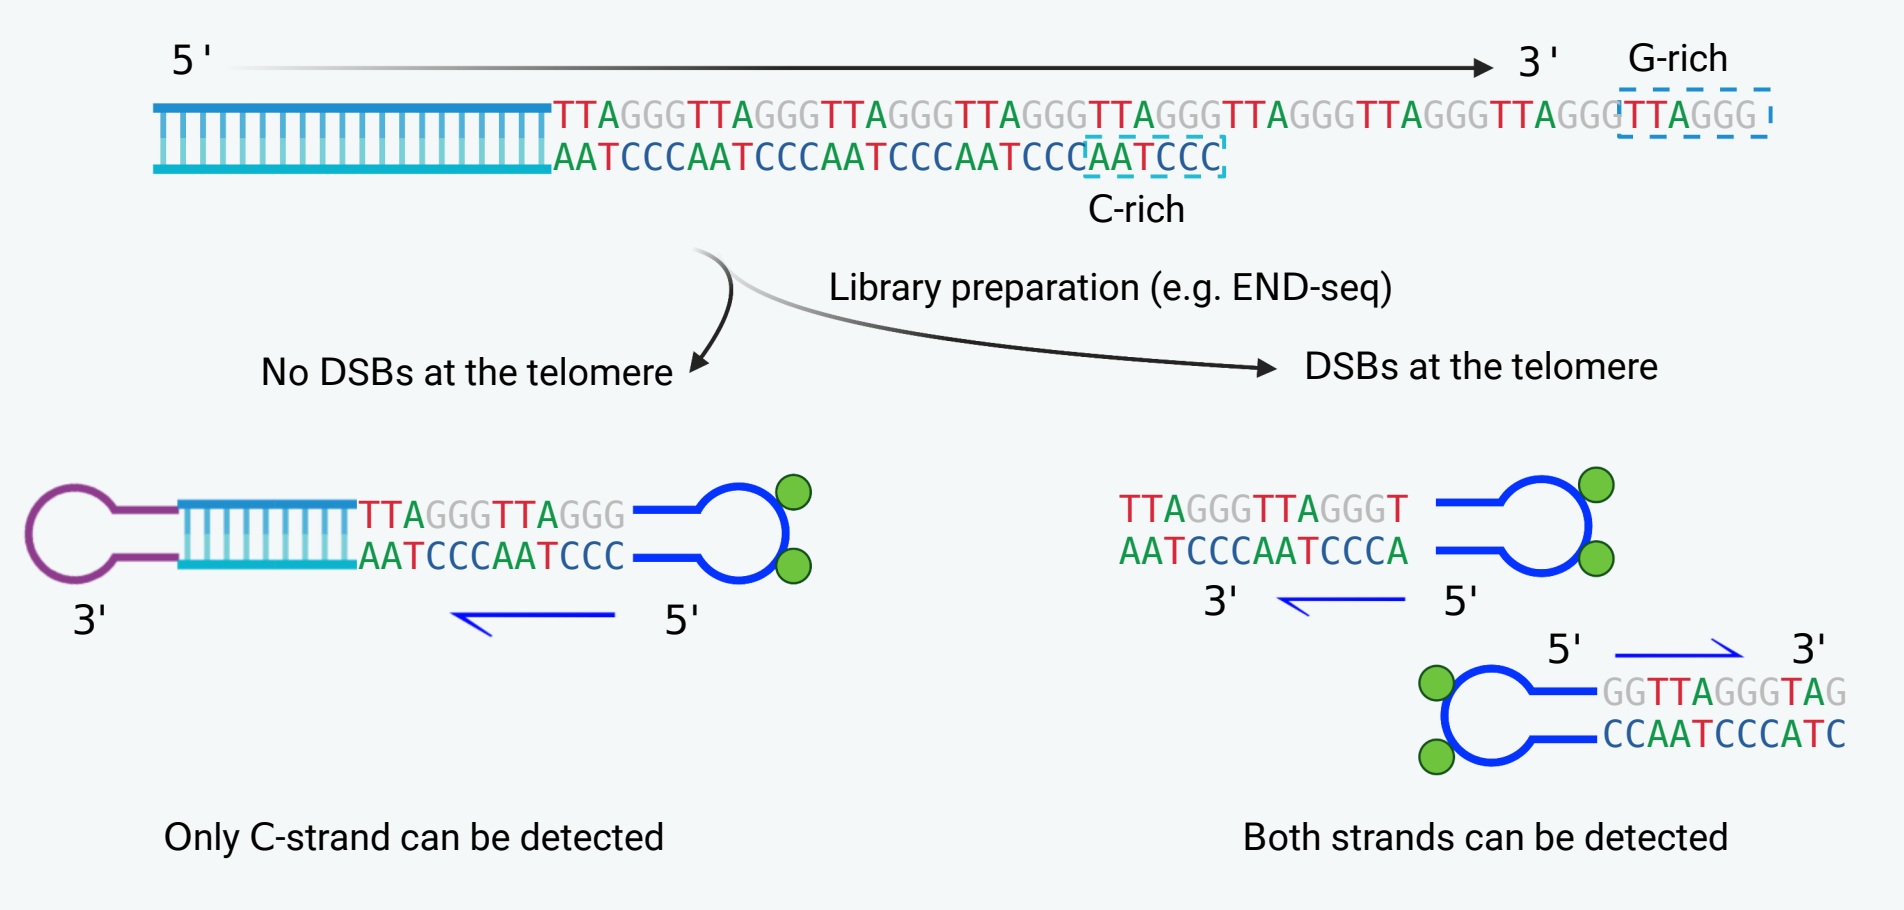
Over the past decade, a number of sequencing approaches have been developed to unveil the genome-wide distribution of DNA double-strand breaks (DSBs) at a single nucleotide resolution. While the primary objective of most of these assays is to detect broken DNA ends, it is worth noting that telomere ends are often captured as well. Taking END-seq as an example, the G-rich overhangs are processed by Exonuclease VII and Exonuclease T during library preparation. Adapters are then ligated to the base where the C-rich strand ends, enabling the determination of the end-nucleotide on the C-rich strand.
Furthermore, techniques such as END-seq will only detect the C-rich strand in the absence of telomeric DSBs while both the G-rich and C-rich strands can be detected when DSBs occur at telomeres. Therefore, the extent of telomeric DSBs can be approximately estimated by analyzing the ratio of reads indicating G-rich strands versus C-rich strands.
To analyze telomere ends and telomeric DSBs, the FASTQ files were scanned for both G-rich and C-rich strands. Reads initiated with more than four (4) copies of C-motif or G-motif were extracted as potential telomeric reads. A plot depicting the preference of nucleotides at the C-strand terminus is generated using the first six (6) nucleotides of C-motif reads. Additionally, a bar graph is provided to illustrate the detailed proportion of different C-strand termini. Finally, the frequency of DSBs occurring at telomeres is approximated by calculating the ratio of G-strand reads to C-strand reads.
Distribution
NGS reads were aligned to the reference genome according to their respective technical types, resulting in BAM files. Subsequently, peak calling was performed using MACS (version 1.4.2) and SICER2 algorithms to identify regions of signal enrichment (narrow and broad peaks). Following the removal of blacklisted regions, the remaining peaks will be utilized for further analysis.
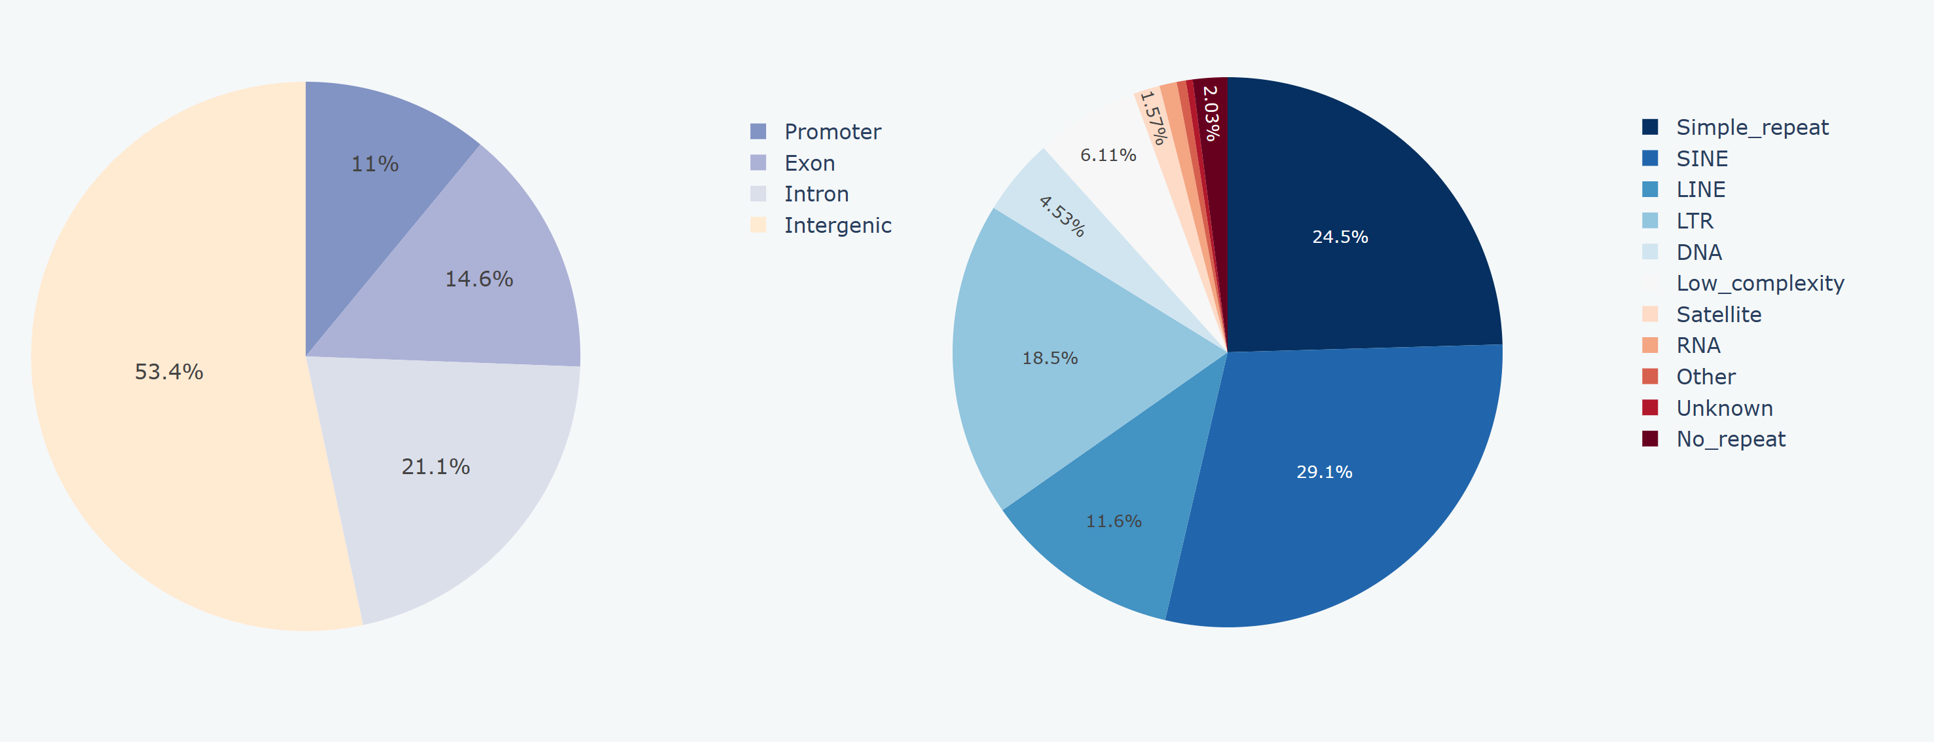
Our website features two pie charts that illustrate the distribution of peaks in relation to genes (i.e., located over promoters, exons, introns, or intergenic regions) and repeats for the given sample. BEDTools were use to annotate the genome based on gene annotations obtained from GENCODE (https://www.gencodegenes.org/) or the UCSC Genome Browser (https://genome.ucsc.edu/). RepeatMasker tool was utilized to annotate the genome based on repeat mask files obtained from the UCSC Genome Browser. Subsequently, the frequency of peaks overlapping with each annotated category was calculated in terms of gene annotation or repeat annotation separately. Furthermore, we provide a bar chart displaying the 10 motifs of simple repetitions that exhibit the highest enrichment of peaks.

Quantification & Visualization
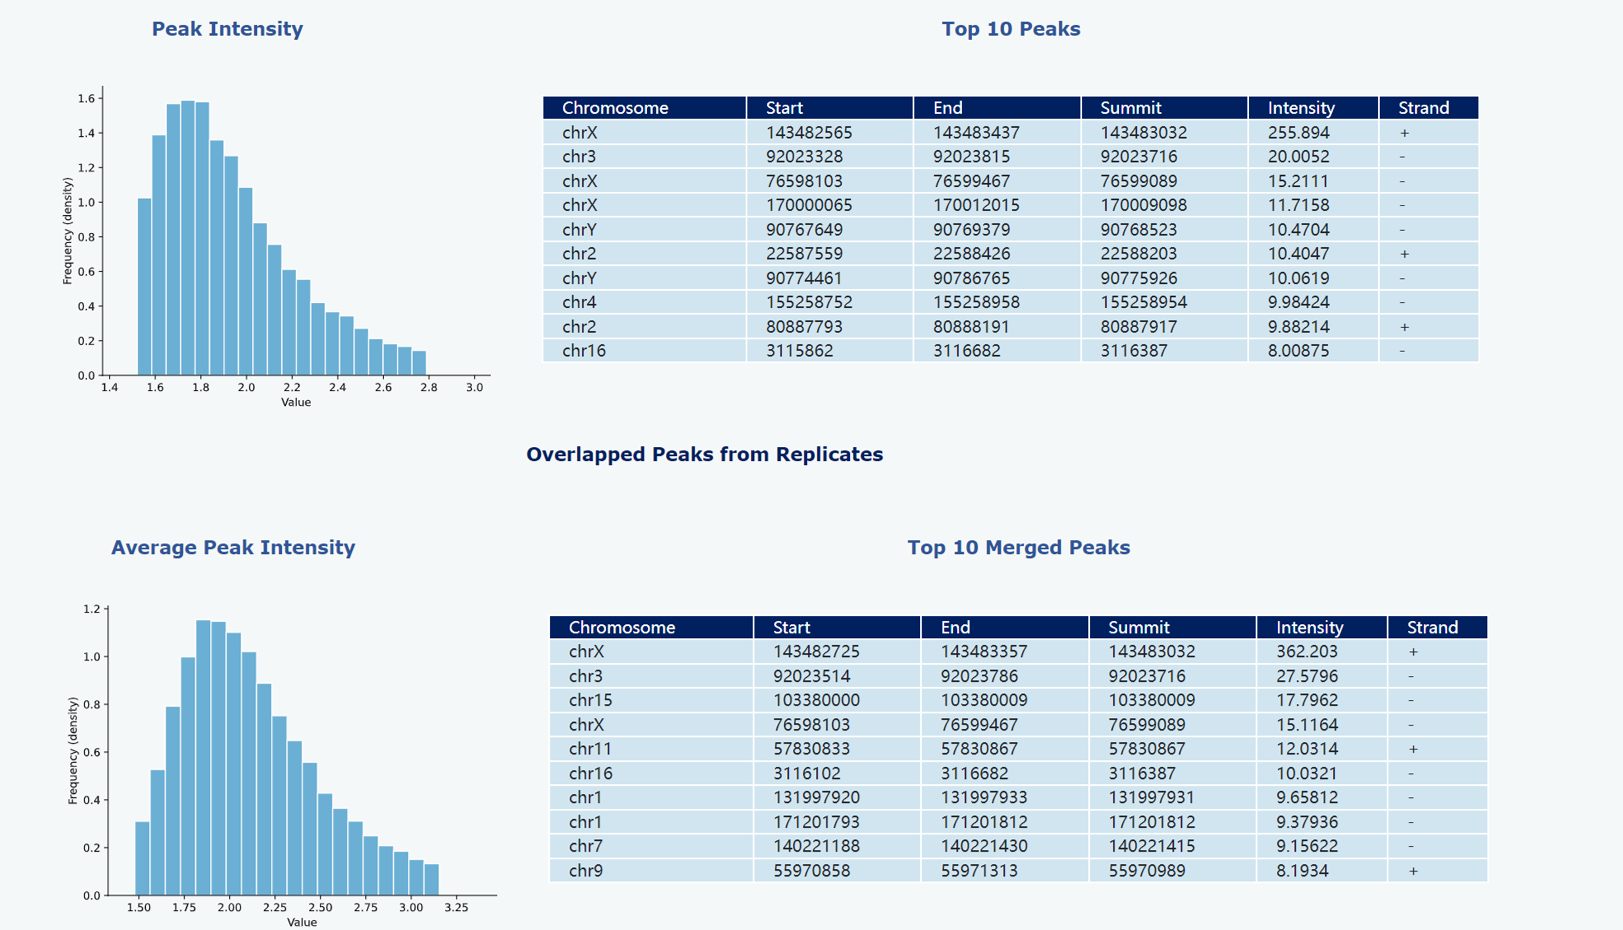
The distribution of peak intensities (RPKM values) has been visualized through a histogram, providing a comprehensive overview. Additionally, a table has been included to present detailed information on the top 10 peaks with the highest intensities
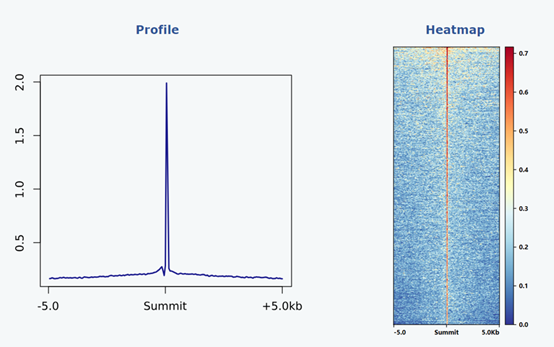
To enable a comprehensive evaluation of read density across peak regions, we utilized Deeptools (version 3.2.1) to calculate the signal strength within a 10kb region extended from the summit position in both upstream and downstream directions. The resulting matrix was then employed to generate a profile plot as well as a heatmap, providing visual representation of peak signals.
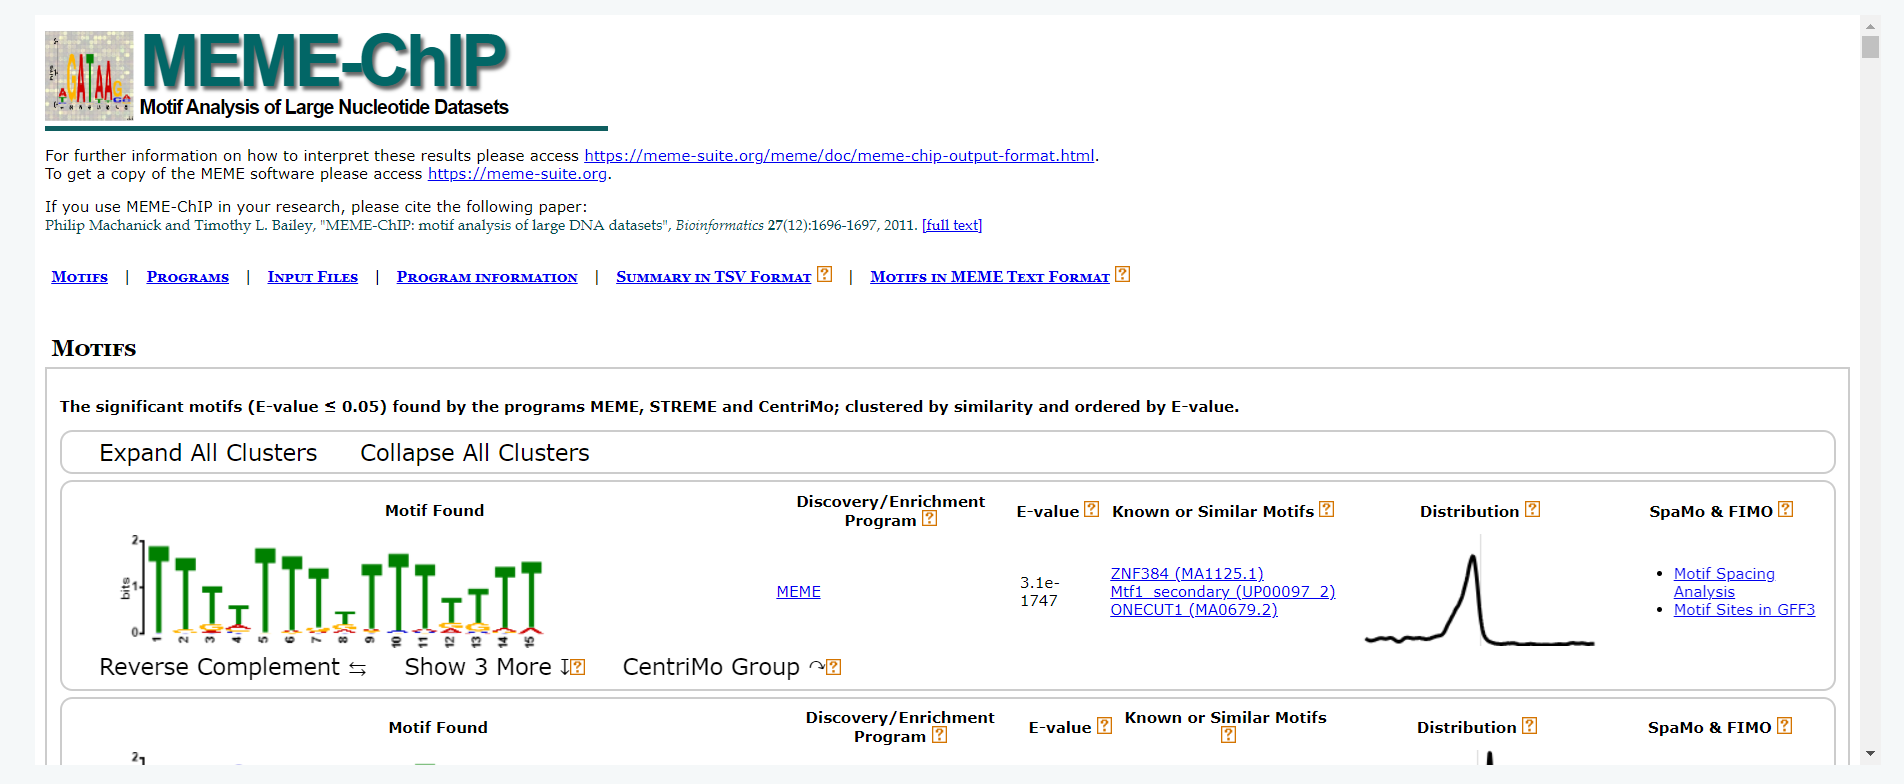
Motif Analysis
We have additionally identified significantly enriched motifs within the peak regions using MEME-ChIP (version 5.5.2). For this purpose, we extracted 200 bp sequences from the summit positions of the top 2,000 peaks on both the upstream and downstream directions. The results has been integrated into this webpage for convenient access.
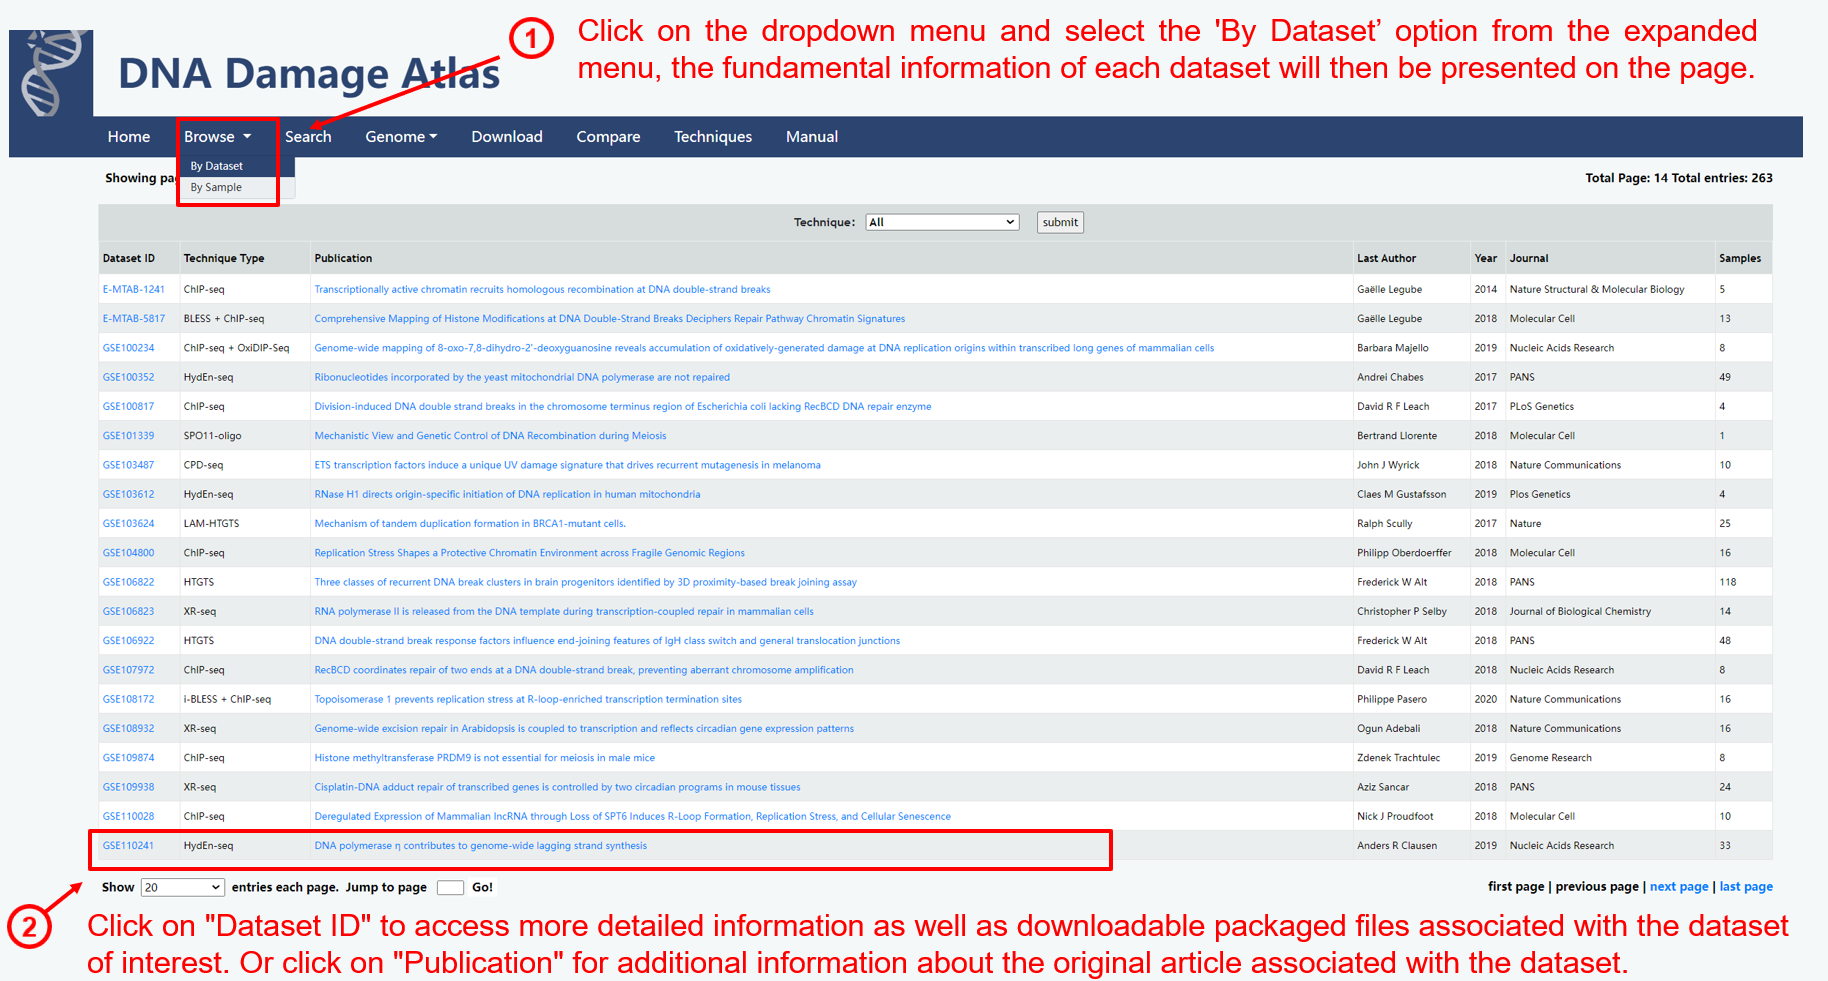
1.2. Browse by dataset
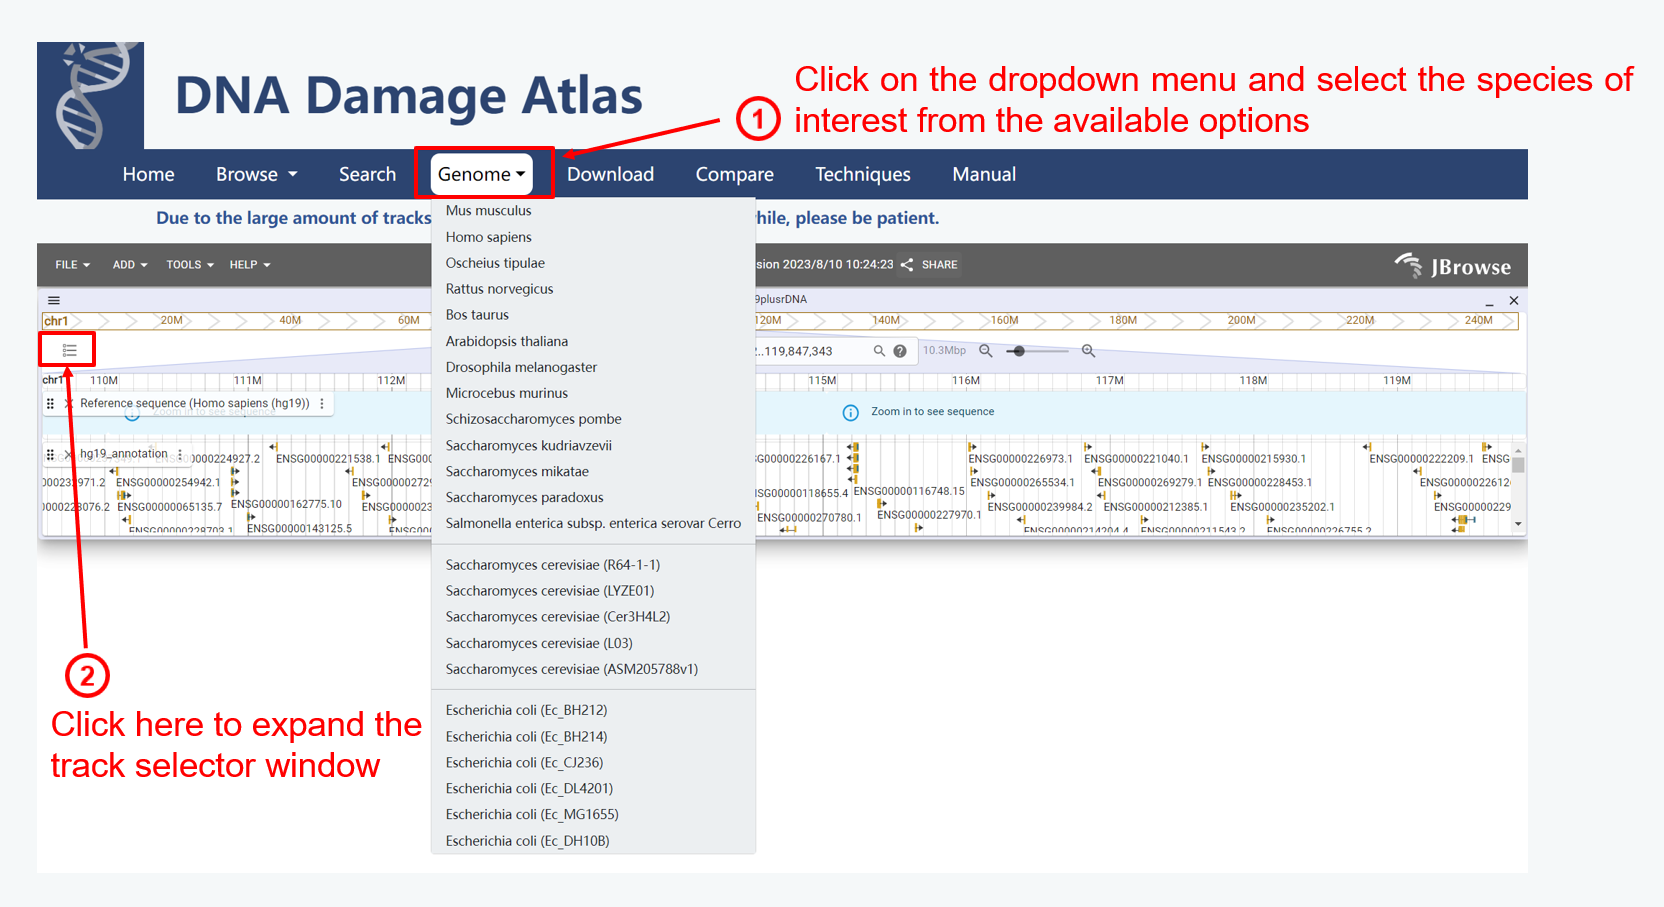
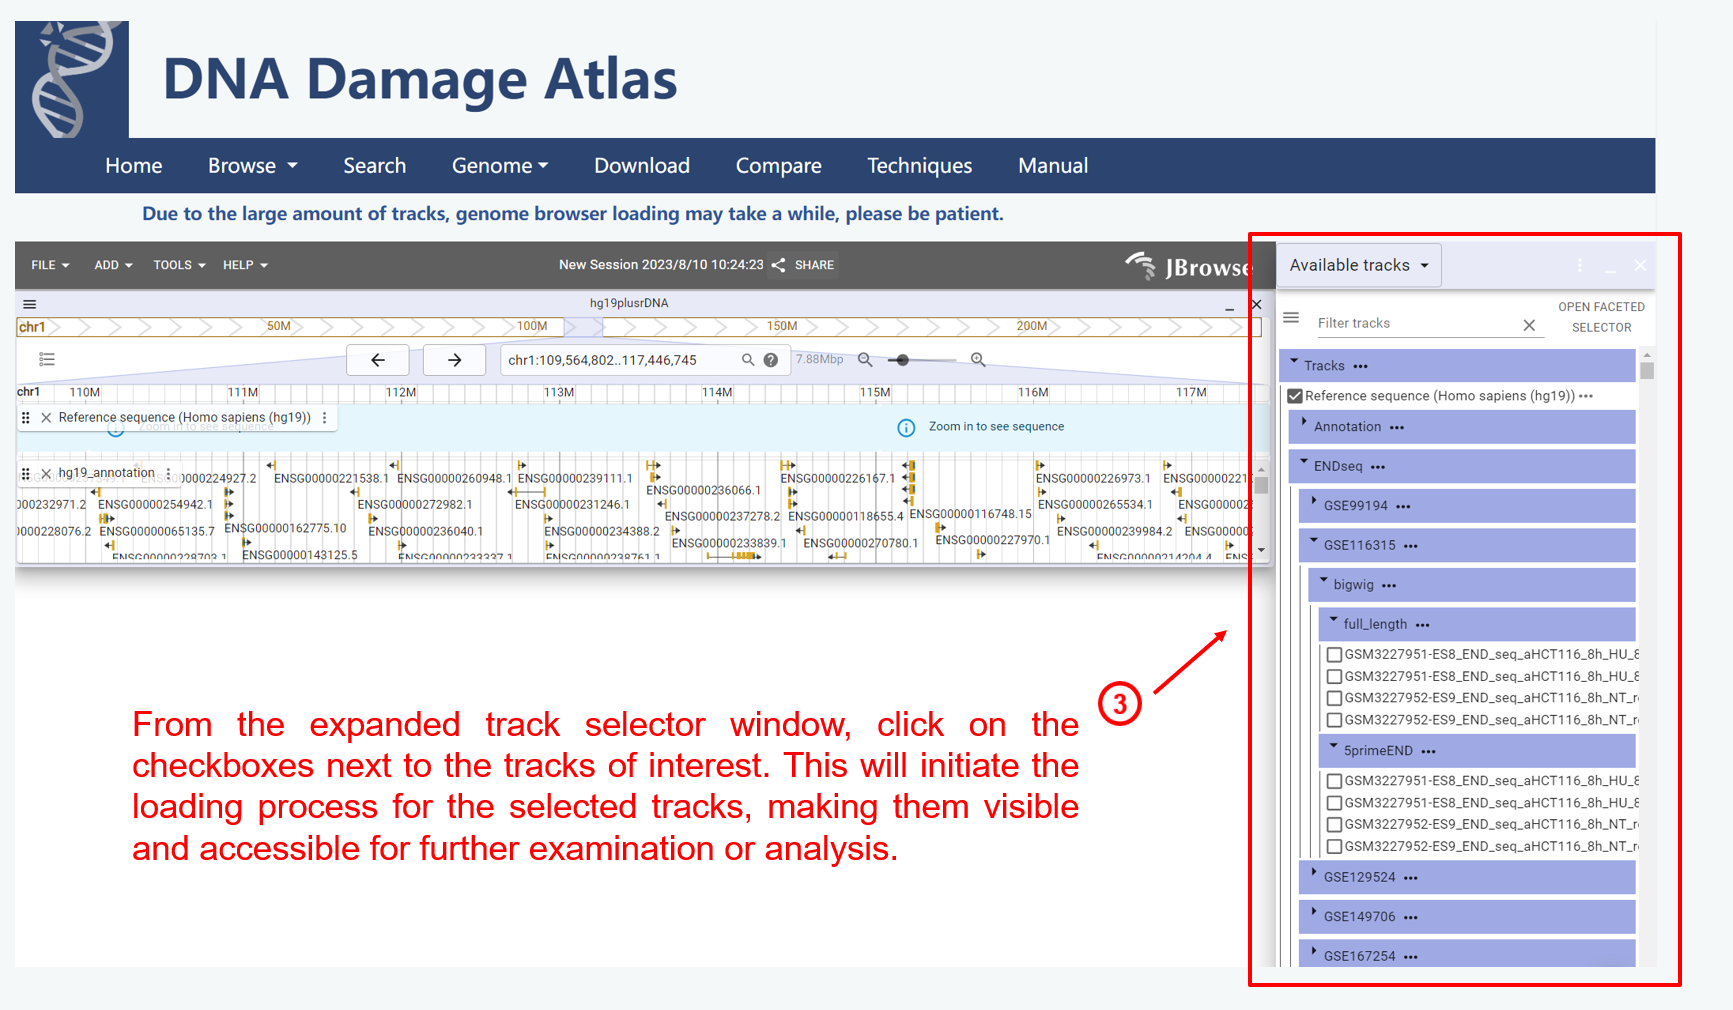
2. Genome module
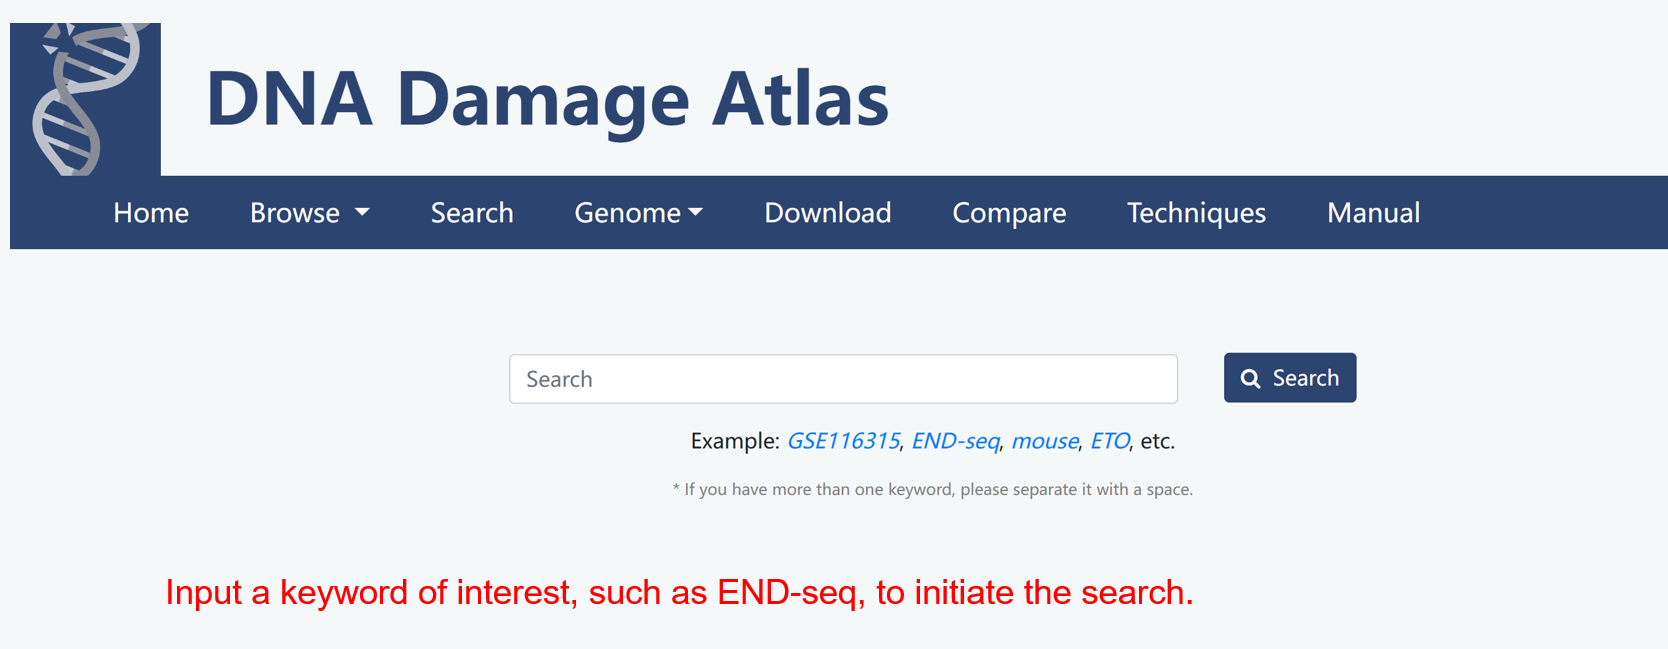
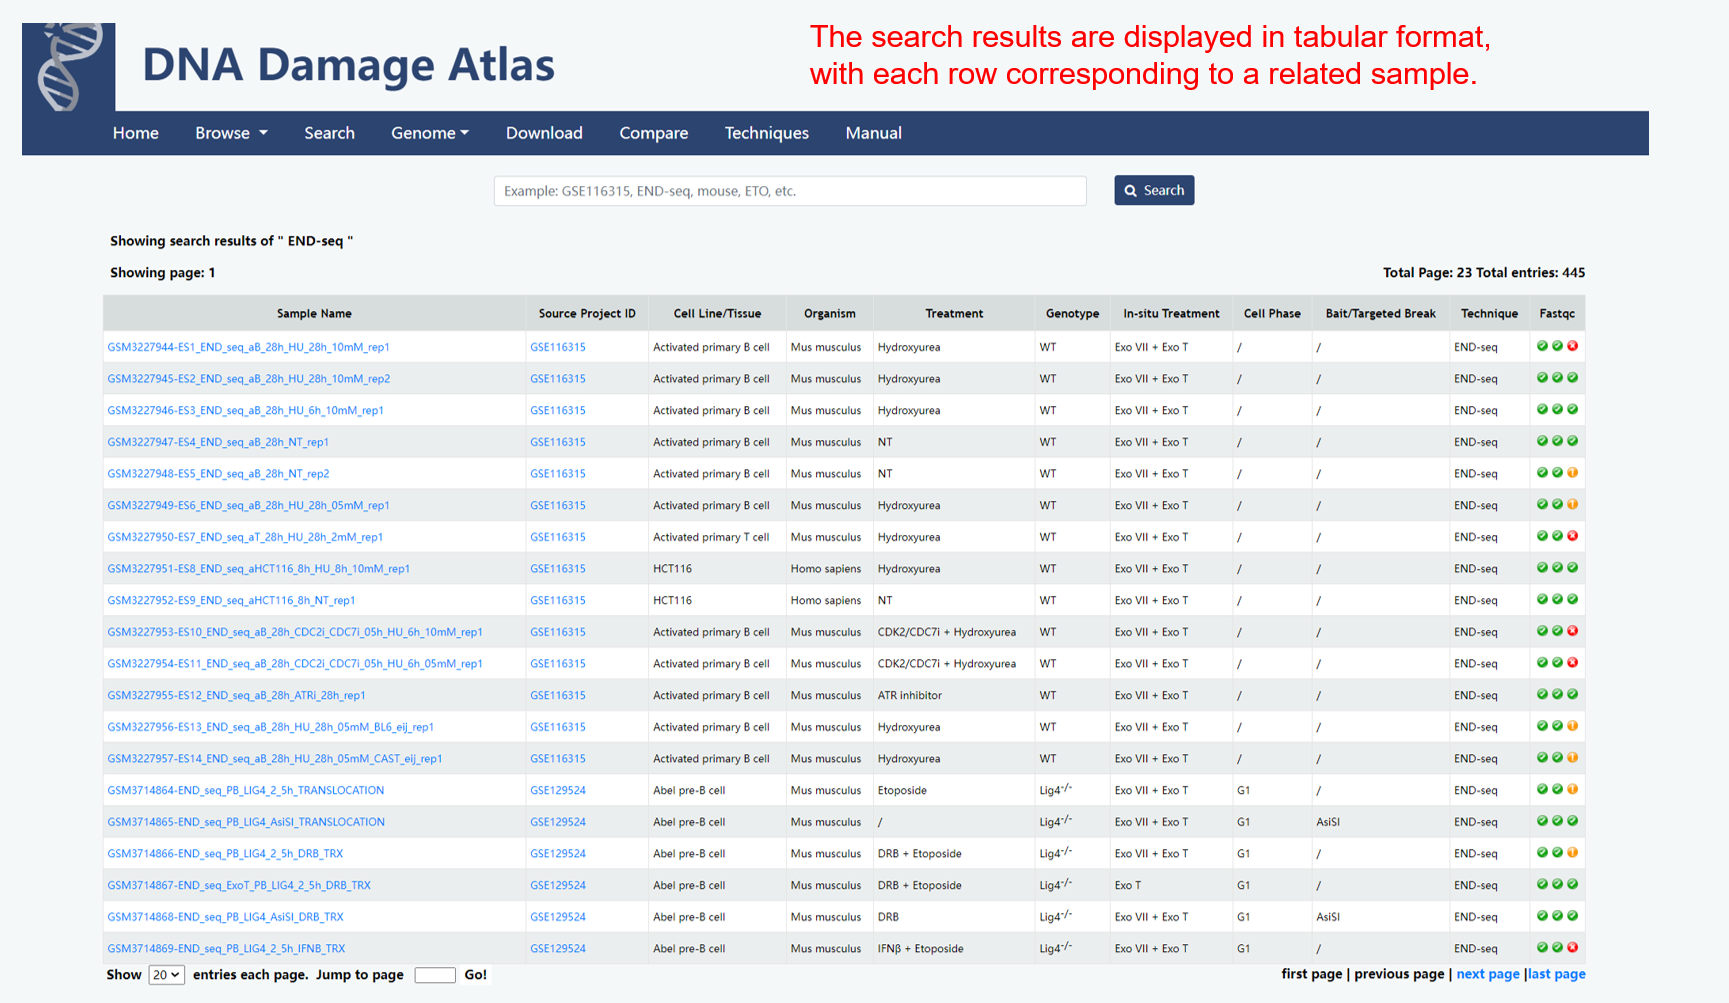
3. Search module
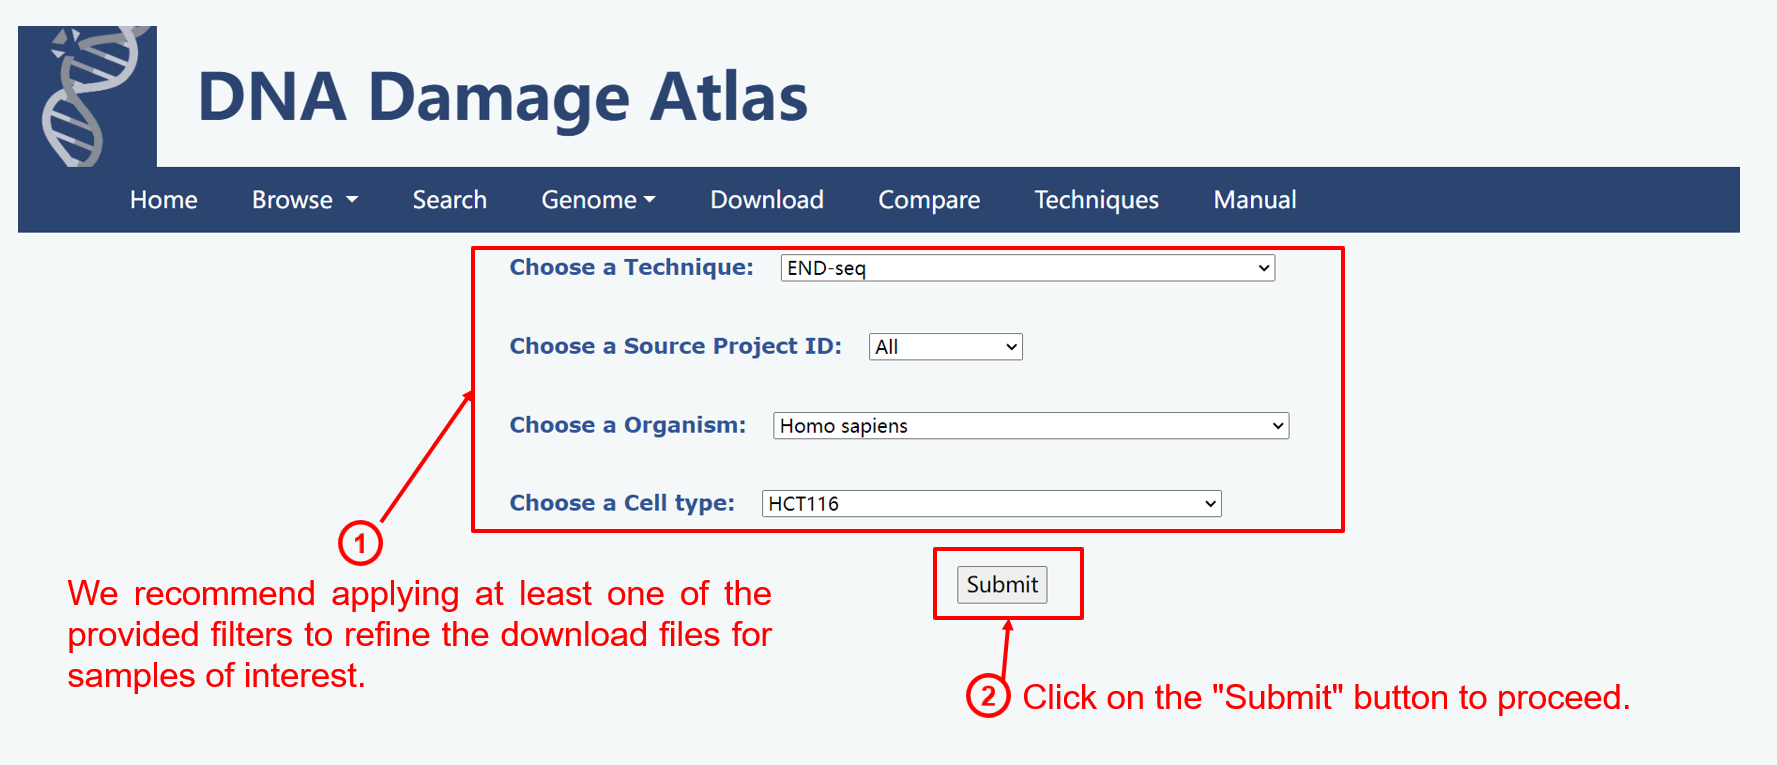
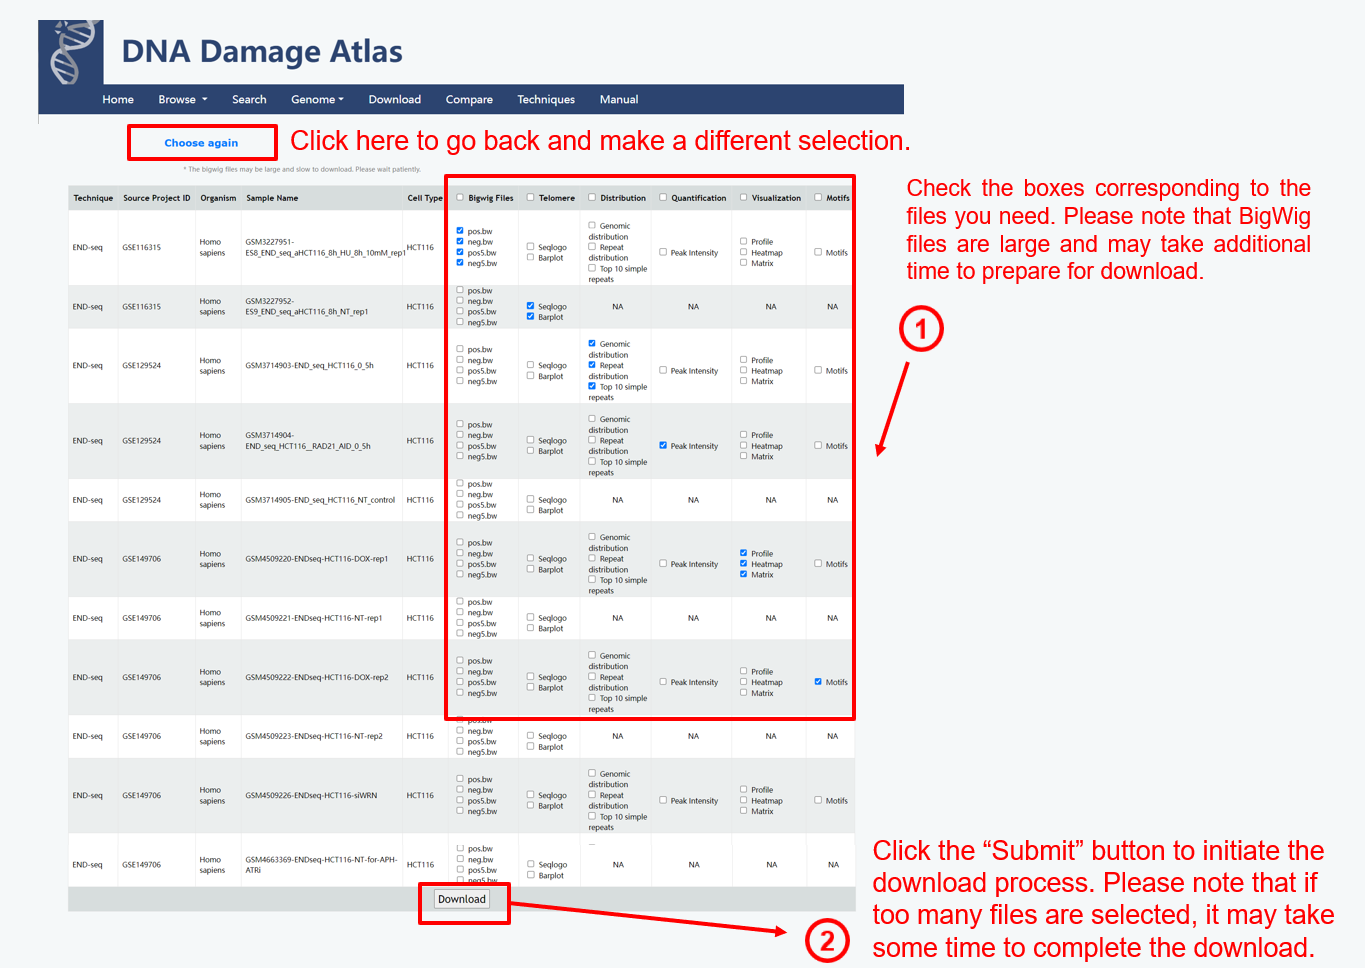
4. Download module
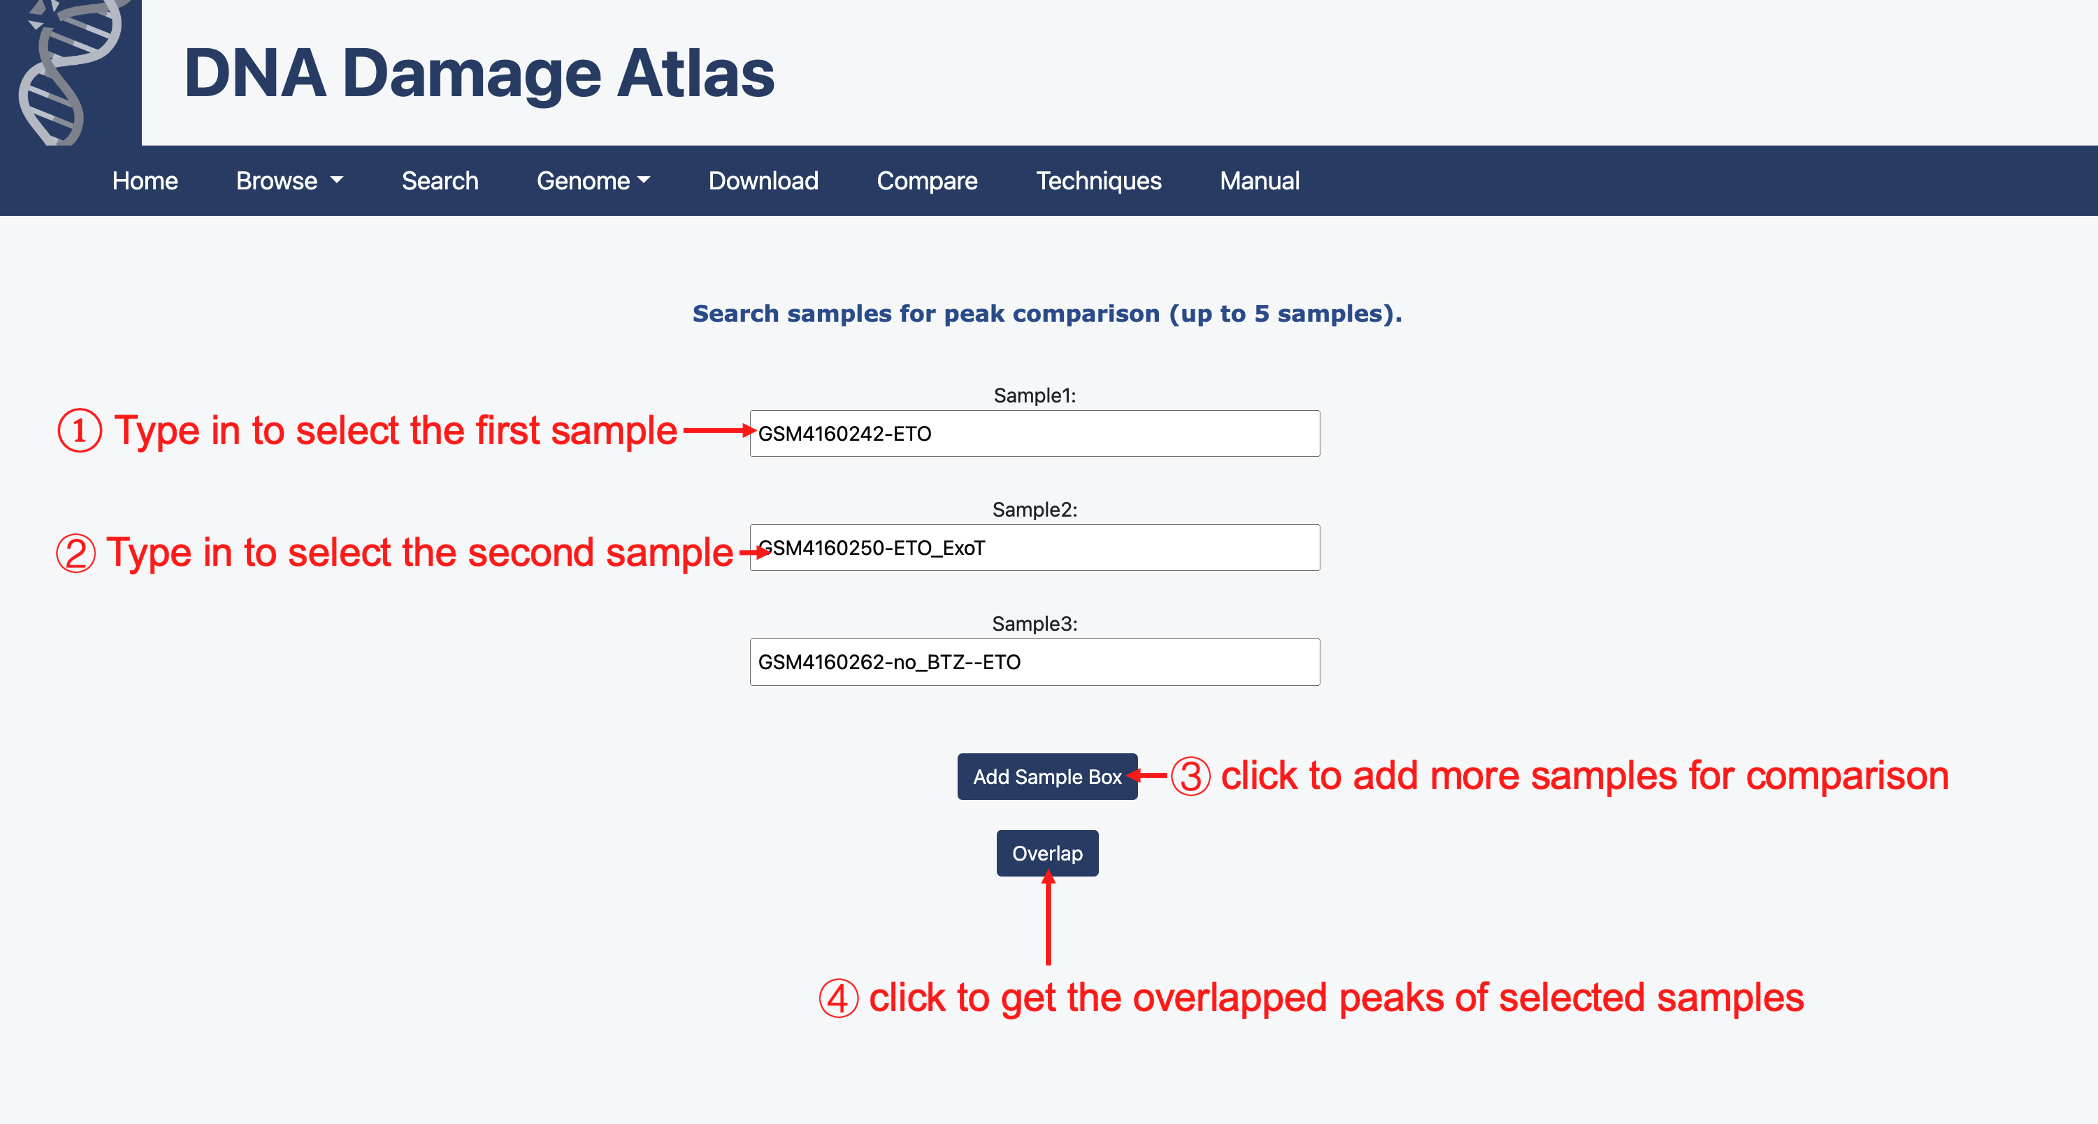
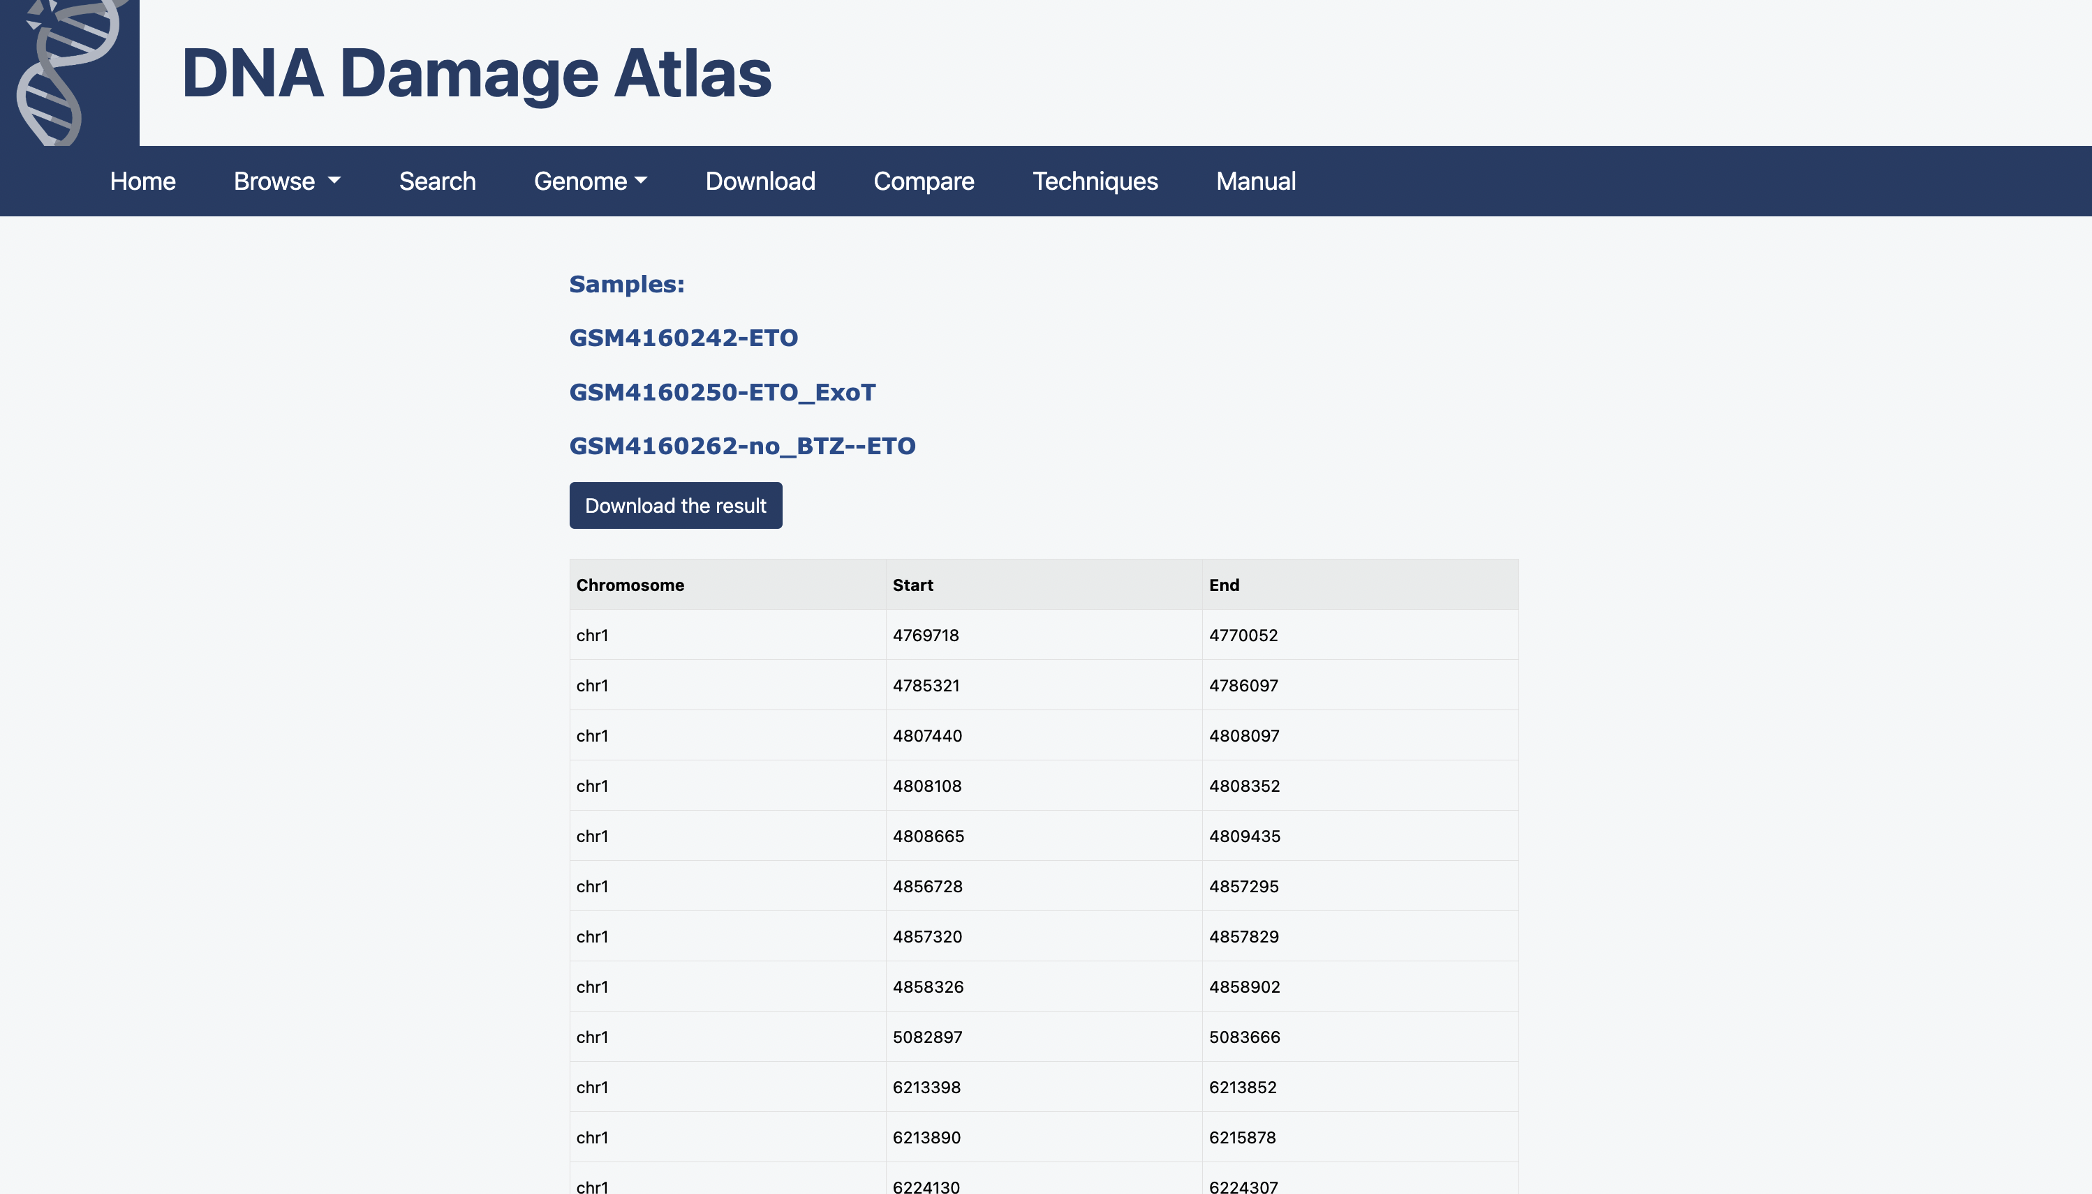
5. Compare
6. Statistics
Damage Types |
Species |
 |
 |
Treatments |
Techniques |
 |
 |
7. FAQ
7.1. What is the data processing workflow in DDA?
Raw data was downloaded from corresponding databases and the sequencing quality was assessed by FastQC. Adapters trimming was primarily executed with Cutadapt except for GLOE-seq, which used Trimmomatic. Depending on the features of the library preparation for different assays, additional processing steps were implemented before the sequencing reads were aligned by bowtie, bowtie2 or BWA, with specific details outlined in GitHub (https://github.com/Bathroomboss/DDA). The ‘view’ and ‘sort’ functions of samtools were utilized to convert and sort the aligned .sam files to sorted .bam files. Then these .bam files were further converted to .bed files using the bedtools bamToBed command. For HTGTS, we directly downloaded the processed files if accessible, otherwise, we will re-run when primer information is available.
7.2. Why is the analysis missing for some samples?
Only techniques that are capable of achieving single-nucleotide resolution and directly capturing the end of thedouble-strand break (DSB) can be employed for telomere analysis.
For some input/control or samples without significant enrichment peaks, downstream analysis were not performed.
Copyright © 2023 All Rights Reserved by Wu lab